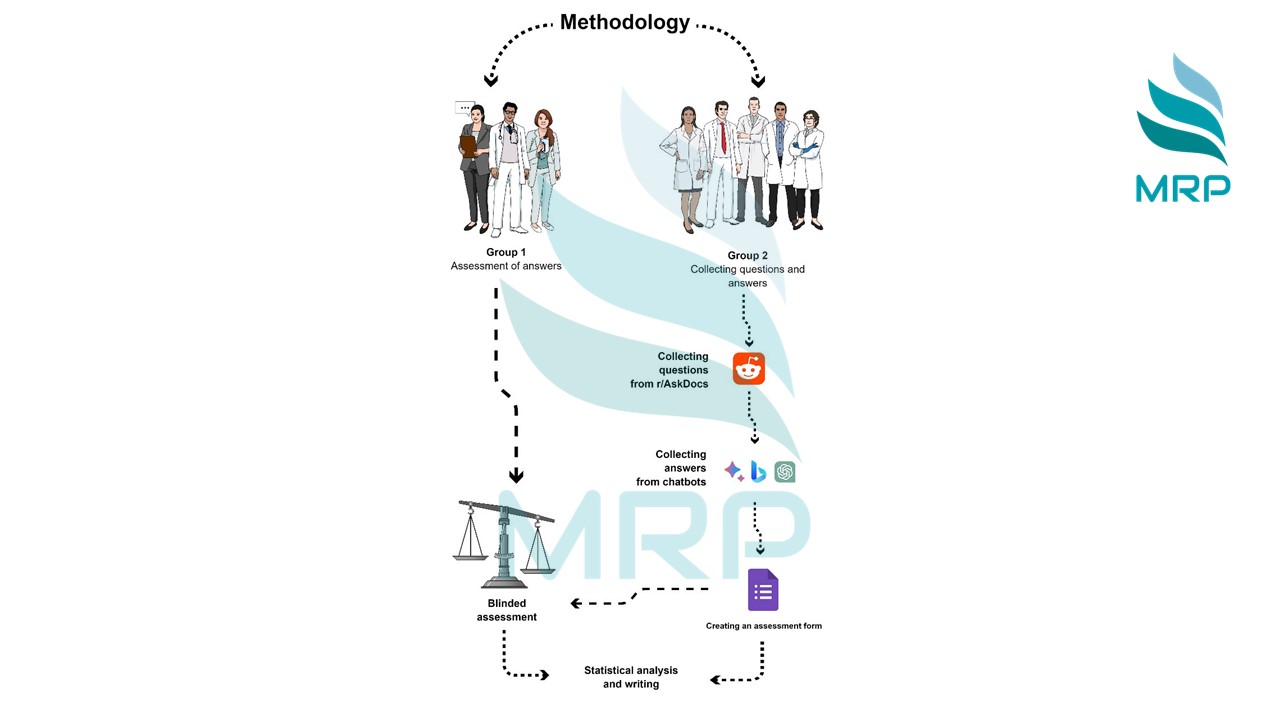
Introduction
In the world of scientific research, data visualization plays a crucial role in effectively communicating complex information. Visual representations not only enhance the understanding of research findings but also make them more engaging and impactful. At Medical Research Platform (MRP), we understand the power of visual storytelling and offer an Illustration and Graph Service to transform your data into compelling visuals. In this article, we will explore how MRP’s service can help you visualize excellence, ensuring that your research speaks volumes with precision and creativity.
Transforming Complex Data
Research data can often be complex and difficult to comprehend, especially for non-experts in the field. MRP’s Illustration and Graph Service specializes in simplifying complex data and presenting it in a visually appealing manner. Our skilled team of illustrators and graphic designers have the expertise to transform intricate datasets into clear and concise visuals. By simplifying complex concepts and highlighting key findings, we ensure that your research is accessible and understandable to a wider audience.
Captivating Illustrations
Illustrations are a powerful tool for conveying scientific concepts and processes. MRP’s team of talented illustrators can create captivating illustrations that bring your research to life. Whether it’s depicting the mechanisms of a biological process, illustrating the structure of a molecule, or visualizing the progression of a disease, our illustrations add depth and visual interest to your scientific narrative. We work closely with you to understand your research objectives and create illustrations that accurately represent your findings with precision and creativity.
Infographics for Impact
Infographics are an effective way to present complex information in a visually appealing and easily digestible format. MRP’s Illustration and Graph Service includes the creation of impactful infographics that summarize your research findings. Our team combines data visualization techniques with creative design elements to produce visually stunning infographics that capture the essence of your research. These infographics can be used in presentations, research papers, or as standalone pieces to engage and inform your audience.
Interactive Data Visualization
In today’s digital age, interactive data visualization has become increasingly popular. MRP’s Illustration and Graph Service can help you create interactive visualizations that allow users to explore your data in a dynamic and engaging manner. Whether it’s an interactive graph, a data-driven animation, or a virtual reality experience, our team has the technical expertise to bring your data to life. Interactive visualizations not only enhance the user experience but also provide a deeper understanding of your research findings.
Tailored to Your Research Narrative
At MRP, we understand that every research project is unique, and the visual representation should align with your research narrative. Our Illustration and Graph Service is tailored to meet your specific requirements and objectives. We work closely with you to understand the key messages you want to convey and the target audience you want to reach. Whether you need visually stunning graphs for a scientific publication or engaging illustrations for a conference presentation, our team will ensure that the visuals align with your research narrative and effectively communicate your findings.
Seamless Integration with Your Research Workflow
Integrating visualizations into your research workflow should be a seamless process. MRP’s Illustration and Graph Service is designed to seamlessly integrate with your existing research workflow. Our team collaborates closely with you to understand your project timeline and deliver visualizations within the specified timeframe. We also provide ongoing support and revisions to ensure that the visuals meet your expectations and accurately represent your research findings.
Trust MRP for Visual Excellence
When it comes to visualizing your research, trust MRP’s Illustration and Graph Service to deliver excellence. Our skilled team of illustrators and graphic designers will transform your complex data into compelling visuals that enhance your scientific narrative. From captivating illustrations to informative infographics and interactive visualizations, we have the expertise to bring your research to life. Partner with MRP and visualize excellence in your scientific endeavors.
Frequently Asked Questions (FAQ)
- Q: Can MRP’s Illustration and Graph Service handle large datasets?
- A: Absolutely! MRP’s team has experience in handling large datasets and can create visualizations that effectively represent the complexity of your data. We employ techniques such as data aggregation, filtering, and interactive features to ensure that your visualizations are both informative and visually appealing.
- Q: Can MRP create custom visualizations based on specific design requirements?
- A: Yes, MRP’s Illustration and Graph Service can create custom visualizations based on your specific design requirements. Our team will work closely with you to understand your design preferences and incorporate them into the visualizations. We aim to create visuals that align with your research narrative and effectively communicate your findings.
- Q: Can MRP’s visualizations be used for both print and digital purposes?
- A: Yes, MRP’s visualizations are designed to be versatile and can be used for both printand digital purposes. Whether you need visuals for scientific publications, conference presentations, or online platforms, our team will ensure that the visualizations are optimized for the intended medium. We can provide high-resolution images for print and interactive formats for digital platforms.
- Q: How long does it take to create visualizations with MRP’s service?
- A: The timeline for creating visualizations with MRP’s service depends on the complexity of the project and the specific requirements. Our team will work closely with you to establish a timeline that aligns with your project deadlines. We strive to deliver high-quality visuals within the agreed-upon timeframe while maintaining attention to detail and precision.
- Q: Can MRP’s service be used for research in any field?
- A: Yes, MRP’s Illustration and Graph Service can be utilized for research in various fields, including but not limited to medicine, biology, chemistry, physics, and environmental sciences. Our team has experience working across different disciplines and can adapt to the specific requirements of your research. We are committed to visualizing excellence in all areas of scientific inquiry.
In conclusion, MRP’s Illustration and Graph Service offers a comprehensive solution for visualizing excellence in medical research. Our skilled team of illustrators and graphic designers can transform complex data into compelling visuals that enhance your scientific narrative. Whether it’s captivating illustrations, informative infographics, or interactive visualizations, we have the expertise to bring your research to life. Trust MRP to deliver precision and creativity in visual storytelling, ensuring that your research speaks volumes.